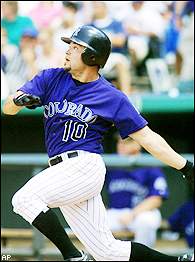
Baseball is likely the only sport where the game can differ massively depending on what team or league you play in. I can't think of any other sport that doesn't have standard field dimensions down to every little aspect, granted you need to keep the infield the same size across parks, but beyond that you can do whatever you want. Giant walls, infinite room in foul territory, a hill in center field, sometimes all you need is an interesting perk to make your team a winner. Not only that but the difference of the designated hitter rule in the AL and NL makes for an interesting dichotomy. Most people prefer to watch AL games as the DH makes games slugfests and inflates offense, but I truly love the NL a lot more. There is so much more strategy in the game to scrape together runs when you can rather than have everybody swing for the big fly. Also, there is nothing like seeing a pitcher deposit a ball into the 6th row. It is moments like that that cause fans to yell "That's how you help your own cause!" at their television screens, or sometimes you get
Tim Hudson taking almost half a minute to round the bases. Because I am a nerd and love numbers, I thought that I should adjust pitchers' ERA to reflect the effective amount of runs they costed their team. Lets get to it!
 |
| Lets not forget Mike Hampton, the only pitcher to hold a bat for his baseball card.. |
So I fetched all of the pitching and batting statistics for National League starters on the morning of 8/9 isn't perfectly current to the writing of this, but it's close enough and we are just doing this for fun. I also want to point out that some pitchers had the luxury of pitching a few games in AL parks during interleague play so they are slightly lacking in at bats while other pitchers have sometimes been used as pinch hitters, either way it would be too much effort for me to take this into account so I didn't. Lastly, any pitcher who had been traded midseason is being counted only for their starts with the team they have the most innings for, it also made things easy for me. So here are the top 10 pitchers according to ERA (min 50 innings).
- Mike Fiers (MIL) 1.80
- Brandon Beachy (ATL) 2.00
- Ryan Dempster (CHC) 2.25
- Ryan Vogelsong (SF) 2.27
- Jordan Zimmerman (WSH) 2.45
- Johnny Cueto (CIN) 2.58
- Kyle Lohse (STL) 2.79
- R.A. Dickey (NYM) 2.82
- Wade Miley (ARI) 2.85
- Clayton Kershaw (LAD) 2.88
Dickey and Zimmerman are probably being negatively effected by the timing of this as they both had fantastic starts the night after collecting the data. I also want to point out that I find it interesting that no team repeats in that top ten, but that is not the point of this. I did a little math magic with my best friend Microsoft Excel to adjust ERA due to excellent hitting and then the top 10 morphs into this.
 |
| I wish this morph would be so cool. |
- Brandon Beachy (ATL) 1.22
- Mike Fiers (MIL) 1.80
- Jordan Zimmerman (WSH) 2.07
- Ryan Dempster (CHC) 2.08
- Ryan Vogelsong (SF) 2.08
- Stephen Strasburg (WSH) 2.26
- Johnny Cuteo (CIN) 2.28
- Wade Miley (ARI) 2.51
- R.A. Dickey (NYM) 2.52
- Kyle Lohse (STL) 2.61
That certainly went better than expected! As you can see this adjustment didn't rock the boat too much (at least for the top 10) but did alter the ordering. Young phenom Stephen Strasburg is the only pitcher to enter the top ten after the adjustment, jumping 5 spots from 11 to 6. Brandon Beachy (sadly done for the season) took a commanding lead over Mike Fiers for the top ERA after Fiers has apparently been completely ineffectual with the bat. I also don't understand R.A. Dickey this year, knuckleballers are not supposed to be so consistent, it's weird! For those interested the average drop in ERA across all pitchers was 0.26, a number that could help contract talks for anybody. Lets see which pitchers get the most benefit.
- Anthony Bass (SD) 4.70 to 3.84 (-0.86)
- Jaime Garcia (STL) 4.48 to 3.66 (-0.82)
- Brandon Beachy (ATL) 2.00 to 1.22 (-0.78)
- Stephen Strasburg (WSH) 2.97 to 2.26 (-0.71)
- Tim Hudson (ATL) 3.77 to 3.11 (-0.66)
- Jonathon Niese (NYM) 3.82 to 3.29 (-0.53)
- Jamie Moyer (COL) 5.70 to 5.20 (-0.50)
- Randy Wolf (MIL) 5.46 to 5.20 (-0.49)
- James McDonald (PIT) 3.42 to 2.96 (-0.46)
- Clayton Richard (SD) 3.79 to 3.34 (-0.45)
Granted Bass, Garcia, Beachy and Moyer have less than 85 IP so their numbers would obviously be helped a little more drastically, but the others all have at least 120 IP so you can assume they have seen continued offensive success. It makes me happy to see Hudson mentioned again although he has not had any chance to speed up his trot time with no home runs this year. Strasburg proves to be the real deal where not only does he have the best batting average for all pitchers by over 50 points (.343) but he also sees ERA drop comparable to players who have thrown nearly half as many innings as he has. Jamie Moyer is 49 years old, that is embarrassing for the younger pitchers out there. I also want to point out how odd it is that two of the pitchers on the list are from San Diego, a home park that deflates all offensive stats and a team that doesn't score runs, so Bass and Richard would probably be a lot more interesting in a more offensive park. There's not a whole lot more to say without spitting out tons more numbers, which I would be willing to do if there was interest. Leave a message in the comment box and I'll do a follow up on this soon.
 |
| UH OH! Hes baaaaack!!! |
Don't think I would tease you with a picture of Mike Hampton earlier and not follow up on it. The guy hit 7 home runs one year, 7! He has 7 home runs in 79 at bats, if he continued that pace to have enough at bats to qualify, that would be the 61st best AB per HR ratio for any season ever. He also has the most Silver Sluggers for a pitcher, winning 5 consecutive titles from 1999-2003. So here's some information about how his career would have been different with this statistic. His career ERA would have been a rather good 3.38 as opposed to an average 4.04. In 2001, when he hit 7 homers, he scored 20 runs and drove in 16, enough to lower his season ERA by a staggering 1.29! In his two years pitching at the bambox that is Coors Field, his ERA would have been lowered from 5.75 to 4.81, neither number is good but any pitcher could use an effectual 0.94 drop on their ERA. In the decade from 1999 until his retirement in 2009, every season would have put him in this year's top ten for ERA differential, and all but two seasons of his total career. Needless to say, Mike Hampton was an interesting pitcher, just look at his baseball cards again.
 |
| What a man. |